|
Direct-touch interaction for scientific visualization
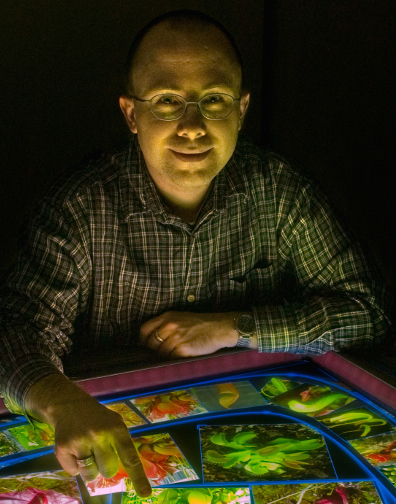
Tobias Isenberg (Inria Saclay) Since the size and complexity of scientific datasets is growing at a very high rate, people are working on developing techniques to effectively depict and visualize them. However, frequently it is not sufficient to just produce a single static visualization but instead we have to support scientists in discovering aspects about the data that they did not know about it. That means that we have to develop effective interactive visualization tools that support scientists in exploring their data. In my talk I will address the problem of interactively visualizing data that has an inherent mapping to the 3D spatial domain such as MRI scans, physical simulations, or molecular models. Specifically, I use interfaces on large, touch-sensitive displays because they tend to give people the feeling of "being in control of their data." That means we face the problem of providing input on a two-dimensional surface which needs to be mapped to manipulations of the three-dimensional data space. I will talk about FI3D, a technique to navigate in 3D datasets and control 7 degrees of freedom with only one or two fingers being used simultaneously. Next, I will discuss the problem of spatial data selection which is fundamental to further data analysis and also requires to define a 3D selection space with only input on a 2D plane. Finally, I briefly mention a case study in which we integrated several different interaction techniques into a tool for fluid mechanics experts to collaboratively explore their data. |